Fine-scale grassland permanent plots
Introduction
The Krkonose Mts. (a mountain range in the northern part of the Czech Republic,
the highest peak 1602 m) reach above the timberline and hence harbour natural
treeless vegetation (alpine meadows above timberline and in avalanche tracks).
In addition to that, there are numerous larger and smaller grassland areas below
the timberline that are due to systematic felling in the area. (These meadows
are 300-400 years old.) The flora of these man-made grasslands contains also
numerous species that descended from natural treeless habitats above the timberline,
such as glacial cirques (e.g. Hypochaeris uniflora, Viola lutea ssp. sudetica,
Anthoxanthum alpinum, Potentilla aurea etc.).
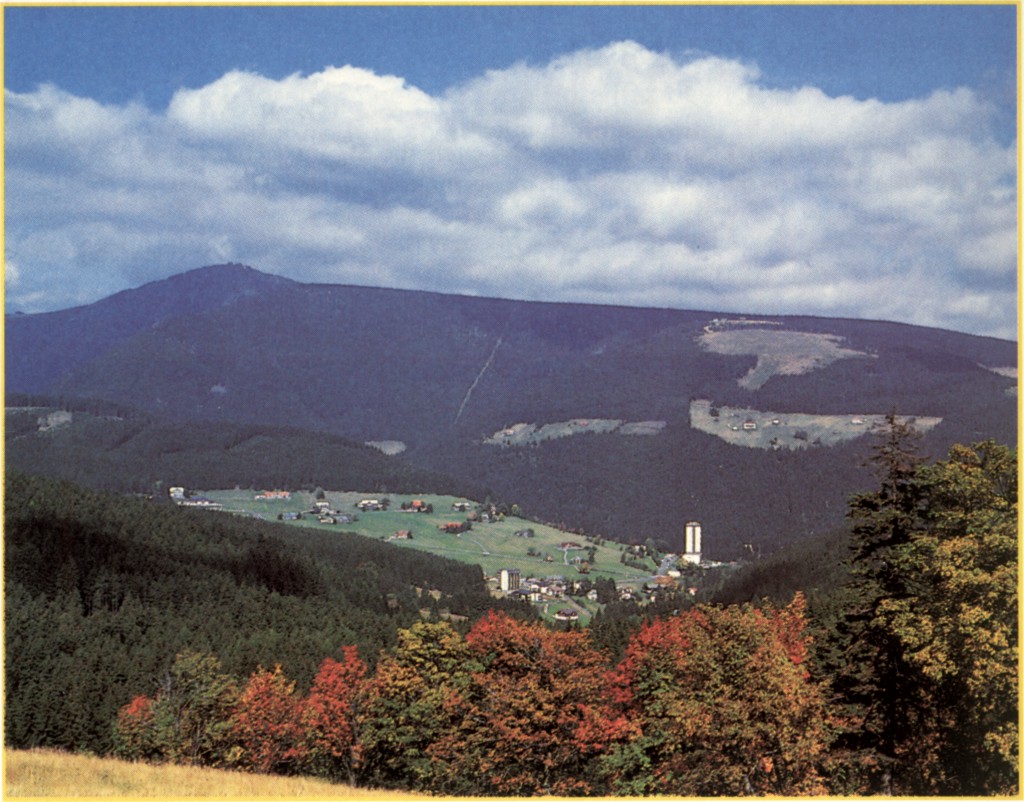
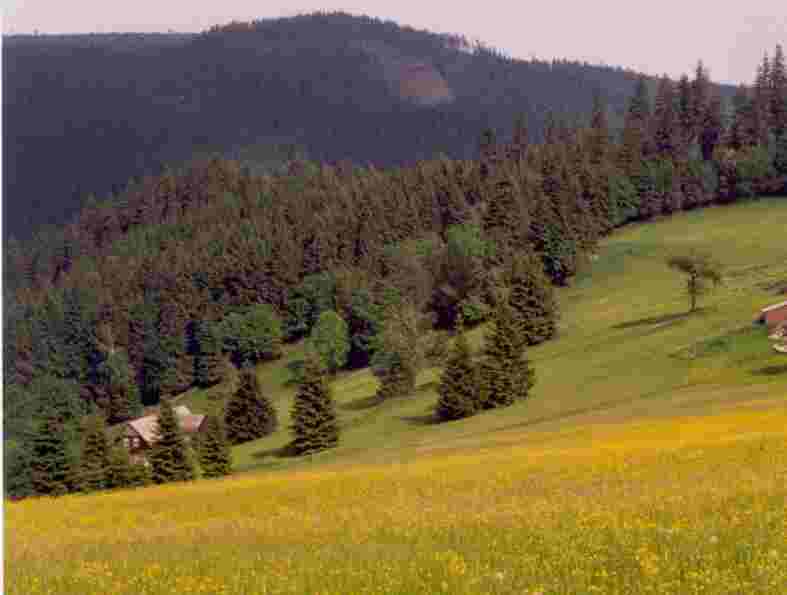
A view of several grassland sites surrounded by forests (the
altitude of the peak, Snezka, is 1602 m; it is the highest peak of the Krkonose
range)
Traditionally these grasslands have been used for cattle-keeping.
The species composition of the grasslands has thus been maintained by human activity,
particularly primarily by mowing (once or twice a year, depending on productivity
of the site) and irregular manuring. However, these meadows have been in steady
decline after the WW II when most of the German population had been forced to
leave and new settlers came into the area; these new settlers not always had
good knowledge or motivation to maintain earlier agricultural practices. This
process of decline was particularly speeded up following intensification of agriculture
in 70ies and 80ies. Since mountain grasslands are largely not suitable for high-input
agriculture, they shared the fate of other low-productivity grasslands elsewhere,
and a major share of them have been abandoned by now; the abandonments results
in developing coarser grain in vegetation structure (i.e. reducing richness at
the fine scale), in dominance of some competitive species (particularly Polygonum
bistorta, sometimes also Holcus mollis, Calamagrostis villosa or
Hypericum maculatum).
Study sites
The intensive research is carried out at two major study sites (species lists
are
here):
- the Severka study site (also referred to as the species-poor site)
is located in a mountain grassland in the Krkonose Mts., ca. 3 km NW of Pec
pod Snezkou, latitude 50o 41' 42'' N, longitude 15o 42'
25'' E, altitude approx. 1100 m. The site has a harsh climate; mean temperature
in the warmest month (July) was 13.6o C (1988), 13.7o
C (1989) at the nearby climatic station (Pec pod Snezkou, ca. 900 m a.s.l.).
There is a long winter with thick snow cover, which lasts generally from November
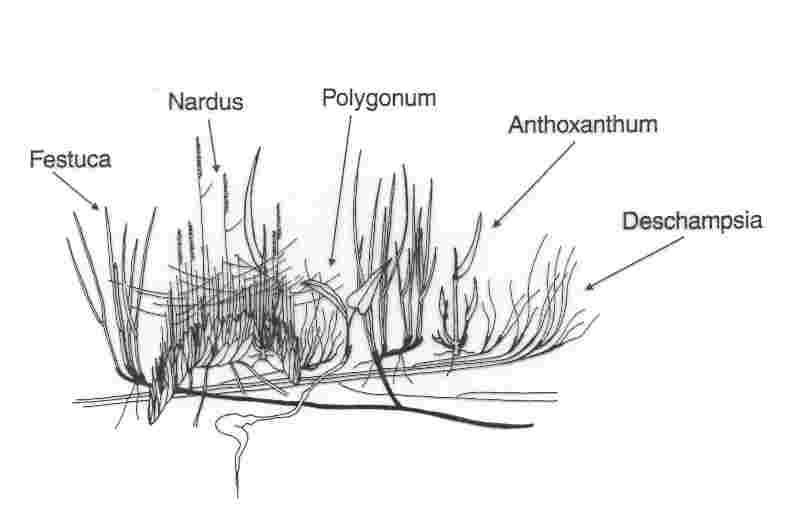
till the end of April. There are only five principal species at the site: Anthoxanthum
alpinum, Deschampsia flexuosa, Festuca rubra, Nardus stricta and Polygonum
bistorta. Though the system is species poor at the large scale, the species
are coexisting at the very fine scale; the species density is 2-4 species/10
cm2 and 6-10 species/2500 cm2. In the Braun-Blanquet classification of the Krkonose
grasslands (Krahulec 1990) the studied grassland is classified as Sileno-Nardetum
(Nardo-Agrostion, Nardetalia), subassociation pleurozietosum. Most
of the research carried out here terminated in 2001. Also recording of
the permanent plots S1 to S4 finished that year.
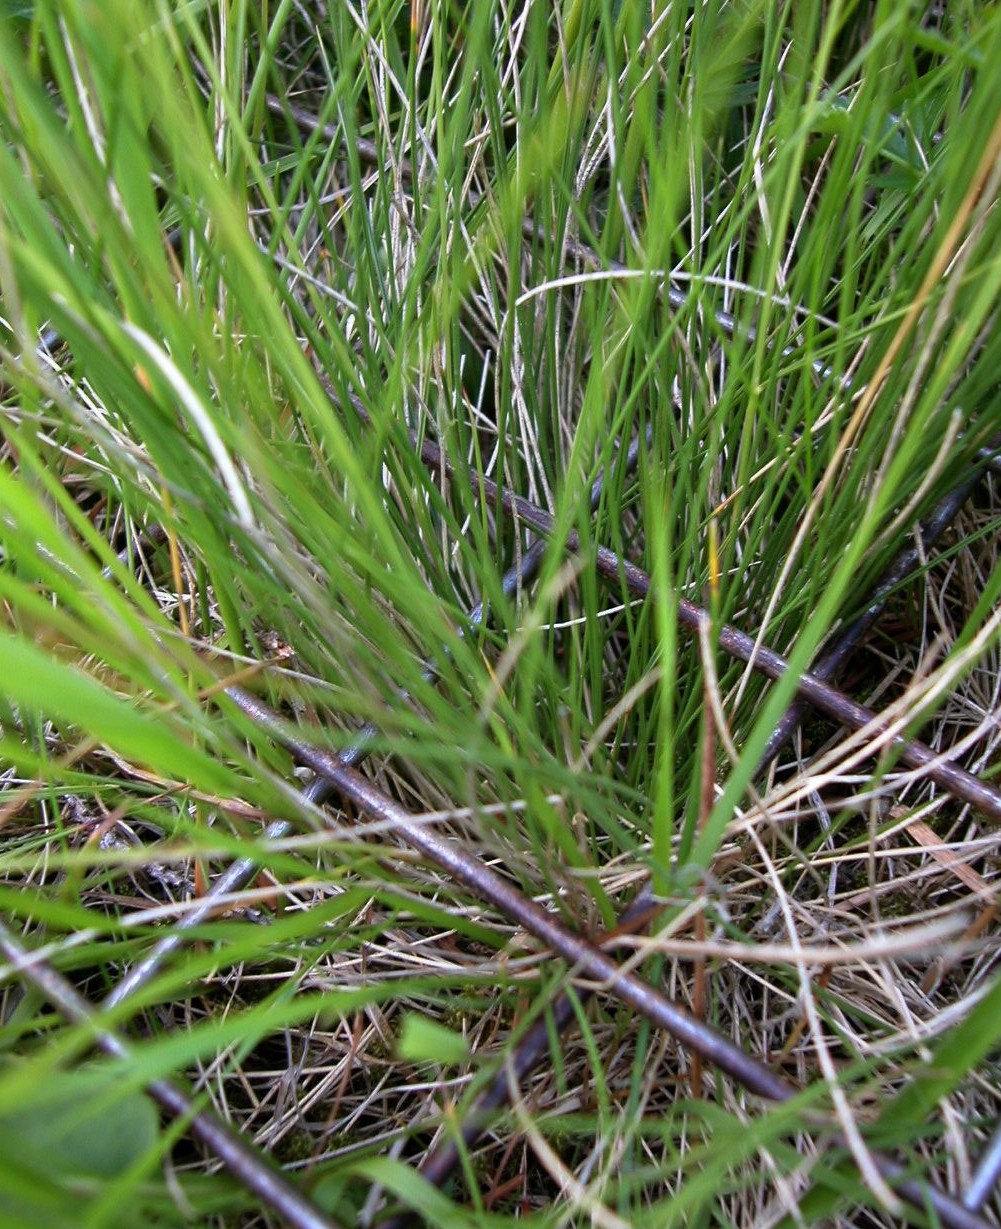
Here are two photographs from a grassland very similar (both in floristic
composition and overall structure) to the Severka site (but taken elsewhere)
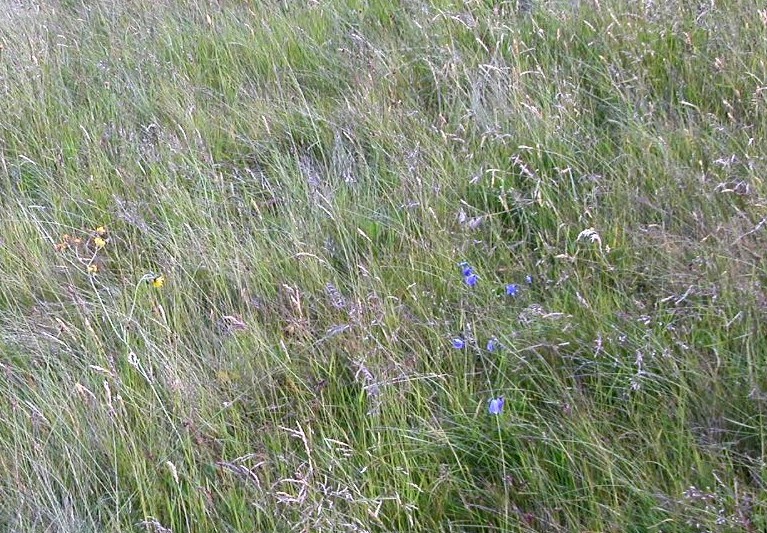
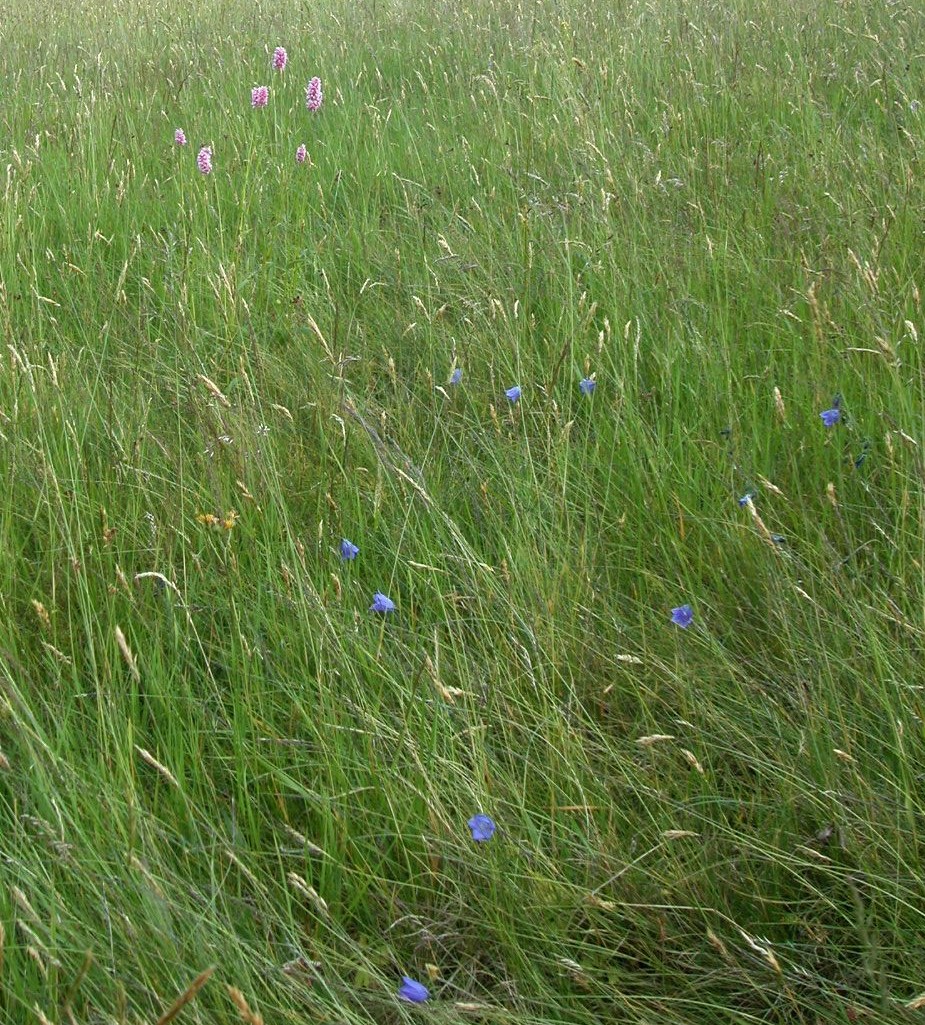
Nardus stricta, Festuca rubra, Anthoxanthum spp., Campanula
spp., Hieracium lachenalii, Polygonum bistorta
An overall view of the Jana site in early summer
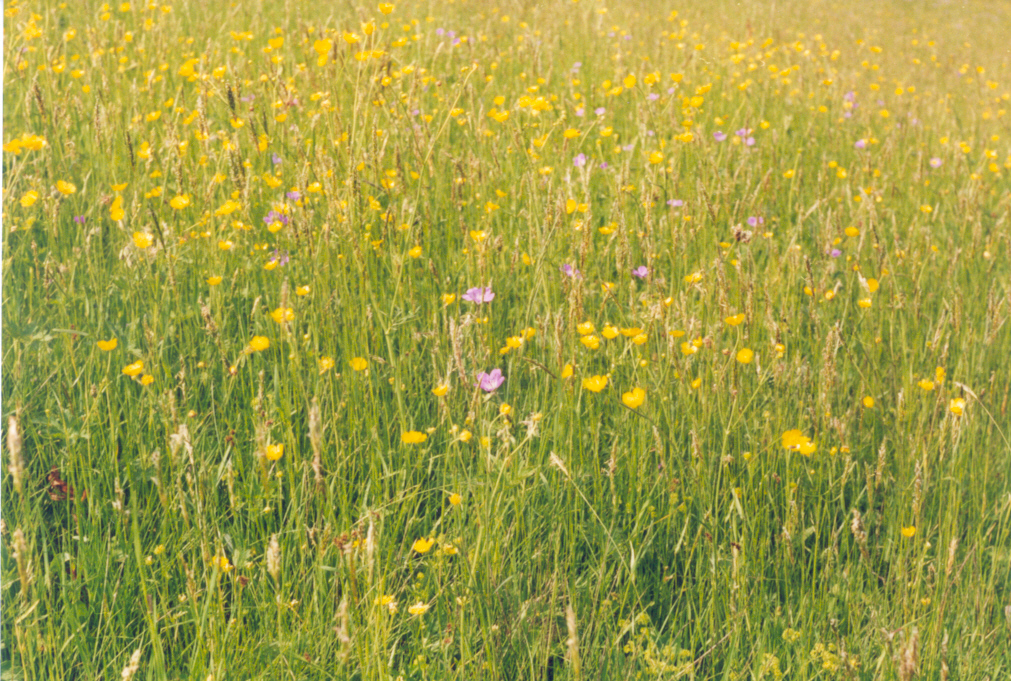
A meadow at the Jana site in June with Geranium sylvaticum,
Ranunculus acris, Rumex acetosa, Alchemilla spp., Anthoxanthum odoratum, (and
many other plants) in flower
Management at the sites
The plots have been managed by clipping that simulated mowing.
No other management has been done at the Severka site (except for manuring -
see below). At the Jana site, the whole grassland has been mown by the owner
some 5-20 (depending on the year) days after the recording/clipping done by
us; therefore the plants that resprouted after the clipping (there was some
regrowth, but usually not much) were thus mown for the second time.
Two plots at each site (S1, S3, J1, J2) have been regularly manured
every four years in September (in 1985, 1989, 1993, 1997, 2001). Local source
manure (cow manure at Severka, horse manure at Jana) was used. This amounted
to adding (approximately) the following amount of nutrients (g/m2):
Total N = 17, NO3-N = 0.2, NH4-N˙=˙3.8, PO4-P
= 2.4.
The remaining four plots were manured only once, in 1997.
Data collection methods
|
|
We recorded fine-scale dynamics using permanent plots
of 50 x 50 cm with grid of cells of 3.3 cm x 3.3 cm. The recording is
done using a wooden frame with steel wires to make the grid; the frame
is positioned using large nails that are permanently marking the site
(see in the corners of the frame - outside). These nails fit into thin
long aluminum tubes in the soil. Repeated positionings of the frame do
not differ by more than 0.5 cm; however, there may be some cumulative
movements of the nails over the years.
|
|
Number of modules (shoots for grasses, leaves for larger
herbs, rosettes for small rosette herbs) of each species rooting in
each cell have been counted every year. Flowering shoots are counted separately.
Plots are recorded yearly in ca. mid June (Jana site) and mid July (Severka
site); after the recording the plots are clipped and the clippings are sorted
into species. (Biomass data at the plot level are also available.)
|
|
The data have been recorded by the number of people; it was impossible to assure
that always the same people did the recordings. While we did cross-checkings,
there still may be some inconsistency in the way how different people interpreted
the plants. Most of the recordings were done (arranged alphabetically) by Stanislav
Brezina, Martina Fabsicova, Vera Hadincova, Tomas Herben, Marcela Kovarova, Frantisek
Krahulec, Sylvie Pechackova, Hana Skalova, Karla Vincenecova and Radka Wildova.
Overview of the data currently available/being recorded for the fine-scale
dynamics
| Severka, four 50 x 50 permanent plots of 15x15 cells |
1984-2001 |
| Jana, four 50 x 50 permanent plots of 15x15 cells |
1985-present |
Data set
The long-term fine-scale permanent plot recording at the both sites has produced
an essentially uninterrupted (exceptions see below) data
series of 18 (Severka) and 19 (Jana) years of 50 cm x 50 cm plots with shoot
counts recorded at the level 3.3 cm x 3.3 cm; sterile and flowering shoots are
listed separately. In particular, the data contain information on spatio-temporal
dynamics at the module level of all species of coexisting clonal plants in one
community at a fine scale.
An example of the data structure is here.
It contains an Excel sheet containing two years of one plot at the Severka site
(S1) and at the Jana site (J1).
|
|
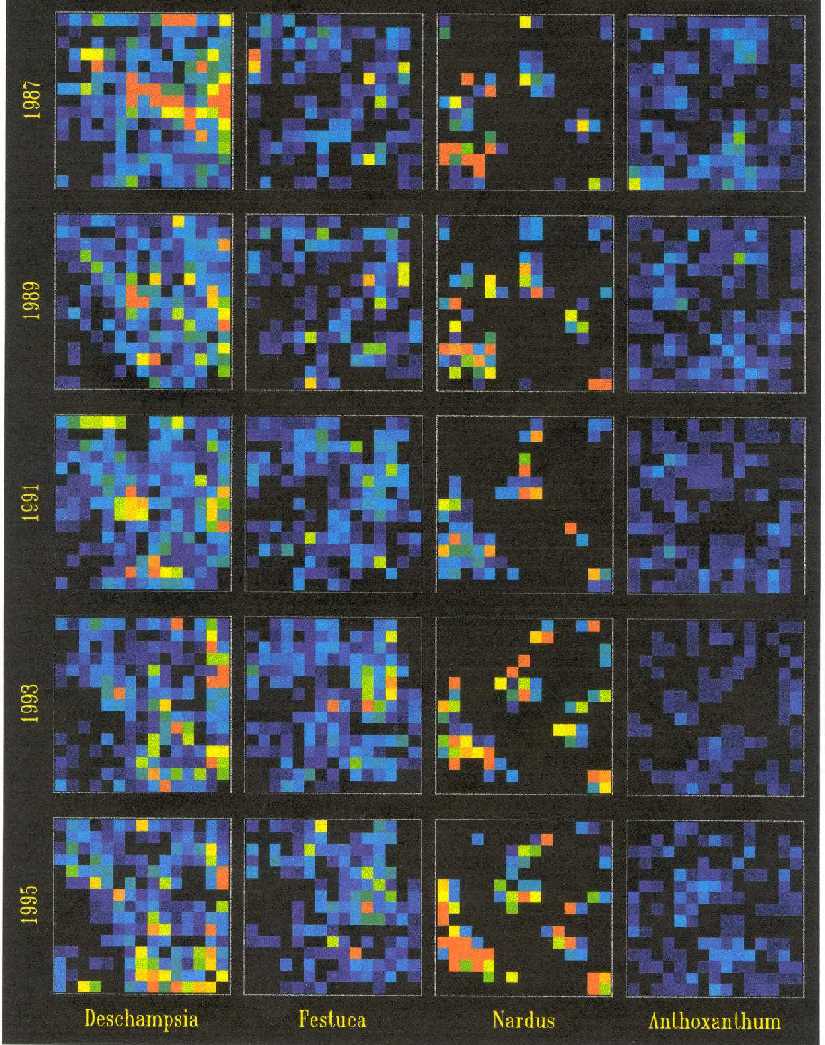
A visual rendering (done by Ulf Dieckmann of IIASA) of the plot S1
(Severka site) over 8 year interval (1987, 1989, 1991, 1993, 1995) is
here. Each row is one recording; each column is one species (Deschampsia
flexuosa, Festuca rubra, Nardus stricta and Anthoxanthum alpinum).
The plot is 0.5x0.5 m; small squares correspond to 3.3 x 3.3 squares
of the field recording.
The rainbow spectrum in the small squares indicates ramet numbers of
these species counted in each grid cell. Note the change in local density
of species over time, while the overall density changes only little.
|
Additional data available
- climatic data from the nearby station starting from 1996 (analysis of biomass/density
- climate relationship is just being done)
- data on biomass sorted into species in each plot
- root distribution below the Severka plots in blocks of identical size as
used for the aboveground recording. After the plots have been abandoned, we
dug the whole plots out and divided the below-ground into blocks 3.3x3.3 cm.
There is a slight difficulty: while the blocks were collected and separated,
roots were never washed out and the whole thing is stored in the freezer (once
we have resources to do it ...)
Then there is 'context' information from many other experiments done at the
site: removal and implant experiments, genet structure of dominant grasses,
root and rhizome distribution, management experiments, demographic data on some
species etc. (see publications below)
Irregularities and problems in the data set
General problems with the recording technique
Although the recording technique is rather well reproducible, there is one
important reason for variation:
- If there is a clump of modules of a species at the line separating two cells
(a common situation), the assignment of these modules to cells may vary from
one recording to the other. Even a very small shift of the frame may change
have an important effect for clumped species like Nardus stricta.
Specific
As any data set that has been collected over rather a long time and by different
people, this data set contains irregularities and missing data. These are mainly
due to the following: (i) recording practices changed over time to some extent,
(ii) people doing the recording learned to identify tiny bits of plants better
over time, (iii) we erroneously recorded a wrong plot once, (iv) start of the
recording was not completely synchronous. These facts account for the following:
- at the Jana site, some rare species (particularly grasses) might have slipped
attention in the early years of recording (when we had difficulties to identify
all sterile shoots). This may concern Briza media, Trisetum flavescens
and perhaps some other species as well
- at the Jana site, one recording of the plot J4 is missing (in 1989)
- at the Severka site in 1985 and 1986, only estimation instead of counting
was done in some cells with very high module numbers. This concerns mainly
Nardus stricta and Deschampsia flexuosa.
- at the Severka site, recording of one plot (S3) started one year later (1985)
than recording of the other plots
- Biomass data from 1985 are missing
Management maintenance
- There are successional trends, particularly at the Severka plots, with increase
of Nardus and decrease of Deschampsia. While this may have many reasons, we
assume that it may be due to the (very regular) clipping (that has been done
perhaps at slightly shorter height that usual mowing would be done).
- The fertilized plots are definitely richer and some species show cycles
following manuring. For logistic reasons the fertilized plots had to be established
at richer part of the meadow anyway, and therefore the differences cannot
be interpreted as the result of our fertilization.
Some analyses already done on the data
- spatial and temporal autocorrelations of species (Herben et al. 1990, 1993,
1994, 1995): both species-rich and species-poor, but limited to 1984-1996
- cross-correlation of species (Herben et al. 1997): only species-poor, 1984-1996
- correlations of species changes (Herben et al. 1995): only species-poor,
1984-1995
- correlation of plot-level data with climate (Herben et al. 1997): only species-poor,
1984-1994
- regression estimation of species-specific competition coefficients (Law
et al. 1997): only species-poor, 1984-1995
- NB. Except for simple autocorrelation analyses (Herben et al. 1993), no
detailed analysis of the data from the species-rich site was published. An
extensive autocorrelation and cross-correlation analyses have been done, but
are still unpublished.
Publications (if no pdf is provided here,
we will be happy to send you reprints. Just please send an e-mail)
Directly based on the data set
- Dieckmann U., Herben T. & Law R. (1999): Spatio-temporal processes in ecological
communities. CWI Quartely 12: 213-238. Abstract
- Herben T., Krahulec F., Hadincova V., Pechackova S. & Kovarova M. (1997):
Fine-scale spatio-temporal patterns in a mountain grassland: do species replace
each other in a regular fashion? Journal of Vegetation Science 8: 217-224.
Abstract
pdf
- Law R., Herben T. & Dieckmann U. (1997): Non manipulative estimates
of competition coefficients in a montane grassland community. Journal of Ecology
85: 505-517. Abstract
pdf
- Herben T. (1996): Permanent plots as tools for plant community ecology.
Journal of Vegetation Science 7: 195-202. Abstract
- Herben T., During H.J. & Krahulec F. (1995): Spatiotemporal dynamics
in mountain grasslands: species autocorrelations in space and time. Folia
Geobotanica and Phytotaxonomica 30: 185-196. Abstract
pdf
- Herben T., Krahulec F., Hadincova V. & Pechackova S. (1995): Climatic
variability and grassland community composition over 10 years: separating
effects on module biomass and number of modules. Functional Ecology 9: 767-773.
Abstract
- Herben T., Krahulec F., Hadincova V. & Pechackova S. (1994): Is a grassland
community composed of coexisting species with low and high spatial mobility?
Folia Geobotanica and Phytotaxonomica 29: 459-468. Abstract
pdf
- Herben T., Krahulec F., Hadincova V. & Kovarova M. (1993): Small-scale
spatial dynamics of plant species in a grassland community over six years.
Journal of Vegetation Science 4: 171-178. Abstract
pdf
- Herben T., Krahulec F., Hadincova V. & Skalova H. (1993): Small-scale
variability as a mechanism for large scale stability in mountain grasslands.
Journal of Vegetation Science 4: 163-170. Abstract
- Herben T., Krahulec F., Kovarova M. & Hadincova V. (1990): Fine scale
dynamics in a mountain grassland. In: Krahulec F., Agnew A.D.Q., Agnew S.
& Willems J.H. (eds.) Spatial processes in plants communities,. SPB Publishers,
The Hague, pp. 173-184. Abstract
Some related publications
- Herben T., Krahulec F, Hadincová V., Pecháčková S., Wildová R. (2003). Year-to-year
variation in plant competition in a mountain grassland. J. Ecol. 91: 103-113.
Abstract
pdf (publisher's notice here).
- Herben T., Suzuki J. (2001). A simulation study of the effects of architectural
constraints and resource translocation on population structure and competition
in clonal plants. Evolutionary Ecology 15: 403-423 Abstract
pdf (Copyright Kluwer Academic Publishers)
- Herben T., Hara T., Hadincova V., Krahulec F., Pechackova S., Skalova H.
& Suzuki J. (2001): Neighborhood effects and genetic structure in a clonal
grass: The role of the spatial structure of the environment. Plant Species Biology
16: 1-11. Abstract
- Herben T., Krahulec F., Hadincova V. & Pechackova S. (2001): Clone-specific
response of Festuca rubra to natural variation in biomass and species
composition of neighbours. Oikos 95: 43-52. Abstract
- Herben T., During H.J. & Law R. 2000. Spatio-temporal patterns in grassland
communities. In: Dieckmann U., Law R. & Metz J.H.J. (eds.) The geometry
of ecological interactions: simplifying spatial complexity, Cambridge University
Press, pp. 48-64. pdf
- Pechackova S., During H.J., Rydlova V. & Herben T. (1999): Species-specific
spatial pattern of below-ground plant parts in a montane grassland community.
Journal of Ecology 87: 569-582. Abstract
- Skalova H., Krahulec F., During H.J., Hadincova V., Pechackova S. &
Herben T. (1999): Grassland canopy composition and spatial heterogeneity in
the light quality. Plant Ecology 143: 129-139. Abstract
- Suzuki J., Herben T., Krahulec F. & Hara T. (1999): Size and spatial
pattern of Festuca rubra genets in a mountain grassland: its relevance
to genet establishment and dynamics. Journal of Ecology 87: 942-954. Abstract
- Herben T., Krahulec F., Hadincova V. & Pechackova S. (1997): Fine-scale
species interactions of clonal plants in a mountain grassland: a removal experiment.
Oikos 78: 299-310. Abstract
- Skalova H., Pechackova S., Suzuki J., Herben T., Hara T., Hadincova V. &
Krahulec F. (1997): Within population genetic differentiation in traits affecting
clonal growth: Festuca rubra in a mountain grassland. Journal of Evolutionary
Biology 10: 383-406. Abstract
- Pechackova S. & Krahulec F. (1995): Efficient nitrogen economy: key
to the success of Polygonum bistorta in an abandoned mountain meadow.
Folia Geobotanica and Phytotaxonomica 30: 211-222. Abstract
- Herben T., Krahulec F., Hadincova V., Kovarova M. & Skalova H. (1993):
Tiller demography of Festuca rubra in a mountain grassland: seasonal
development, life span, and flowering. Preslia 65: 341-353. Abstract
- Skalova H. & Krahulec F. (1992): The response of three Festuca rubra
clones to changes in light quality and plant density. Functional Ecology 6:
282-290. Abstract
- Herben T. & Krahulec F. (1990): Competitive hierarchies, reversals of
rank order and the de Wit approach: are they compatible? Oikos 58: 254-256.
Further publications can be found at our Krkonose
page and at the page of Tomas
Herben